
Cole Baril
Thursday, October 1, 2026 | 18 minutes
What's Buzzing in my Backyard? A Summer of Trapping Mosquitoes
You trap mosquitoes… in your backyard?
Understandably, this is the first question everyone asks when I explain that I am collecting mosquitoes from my backyard. The short answer: curiosity. I often drive or walk past a wetland, ditch or patch of trees and wonder: what mosquitoes are there? How many? This summer, I realized that with the right equipment, I could start answering those questions myself. Science doesn’t have to stay at the door when I leave my place or work or study.
I also wanted to explore questions like:
- How does weather affect mosquito abundance and species composition?
- What happens to mosquito populations after the city carries out mosquito fogging?
- Can I consistently trap and identify mosquitoes in my own backyard?
- Will I find any unexpected species?
- Establish a baseline and track how developments in the area impact mosquito fauna.
This blog post follows my backyard mosquito trapping project throughout the summer, sharing what I found, what surprised me, and what I learned along the way.
Citizen Science
To get started with mosquito trapping, I first needed a trap. When I ran a mosquito surveillance program in Western Manitoba for two years, we used the CDC Miniature Light Trap (with the light removed to reduce non-mosquito bycatch). The CDC Light Trap is the gold standard for adult mosquito surveillance and is very effective at attracting host-seeking female mosquitoes.
However, they are very expensive and cost-prohibitive for hobbyist entomologists as a DIY option. After a bit of research, I discovered that CDC Light Traps can be 3D printed. This publication describes their process in detail. At the same time, by sheer serendipity, my work colleague was presenting on her work involving 3D printed mosquito traps. I reached out to ask about the 3D print files, and not only did she graciously send me the print files, but she offered to send me an assembled trap if in return, I provide mosquito identification data throughout the summer which I was thrilled to do!
 TIMO-CS study logo
Thus, I joined the Tiger Mosquito Citizen Science (TIMO-CS) study. The TIMO-CS study, a Public Health Agency of Canada and Let’s Talk Science initiative that enlists volunteers to help monitor the spread of the invasive Asian tiger mosquito (Aedes albopictus). Since the initial index event in Windsor-Essex in 2016, Ae. albopictus has been considered to be established in the region of Canada. The project expands mosquito surveillance by collecting observations from areas where routine traps aren’t located.
Study participants receive a mosquito trap and supplies to collect mosquitoes in their backyards. Study participants range from citizens, academics, and government organizations.
While Aedes albopictus has not been identified in Manitoba and is not known to exist in the province, my data serves as a negative control to validate statistical models (assuming I do not find Aedes albopictus).
Trapping and Identification
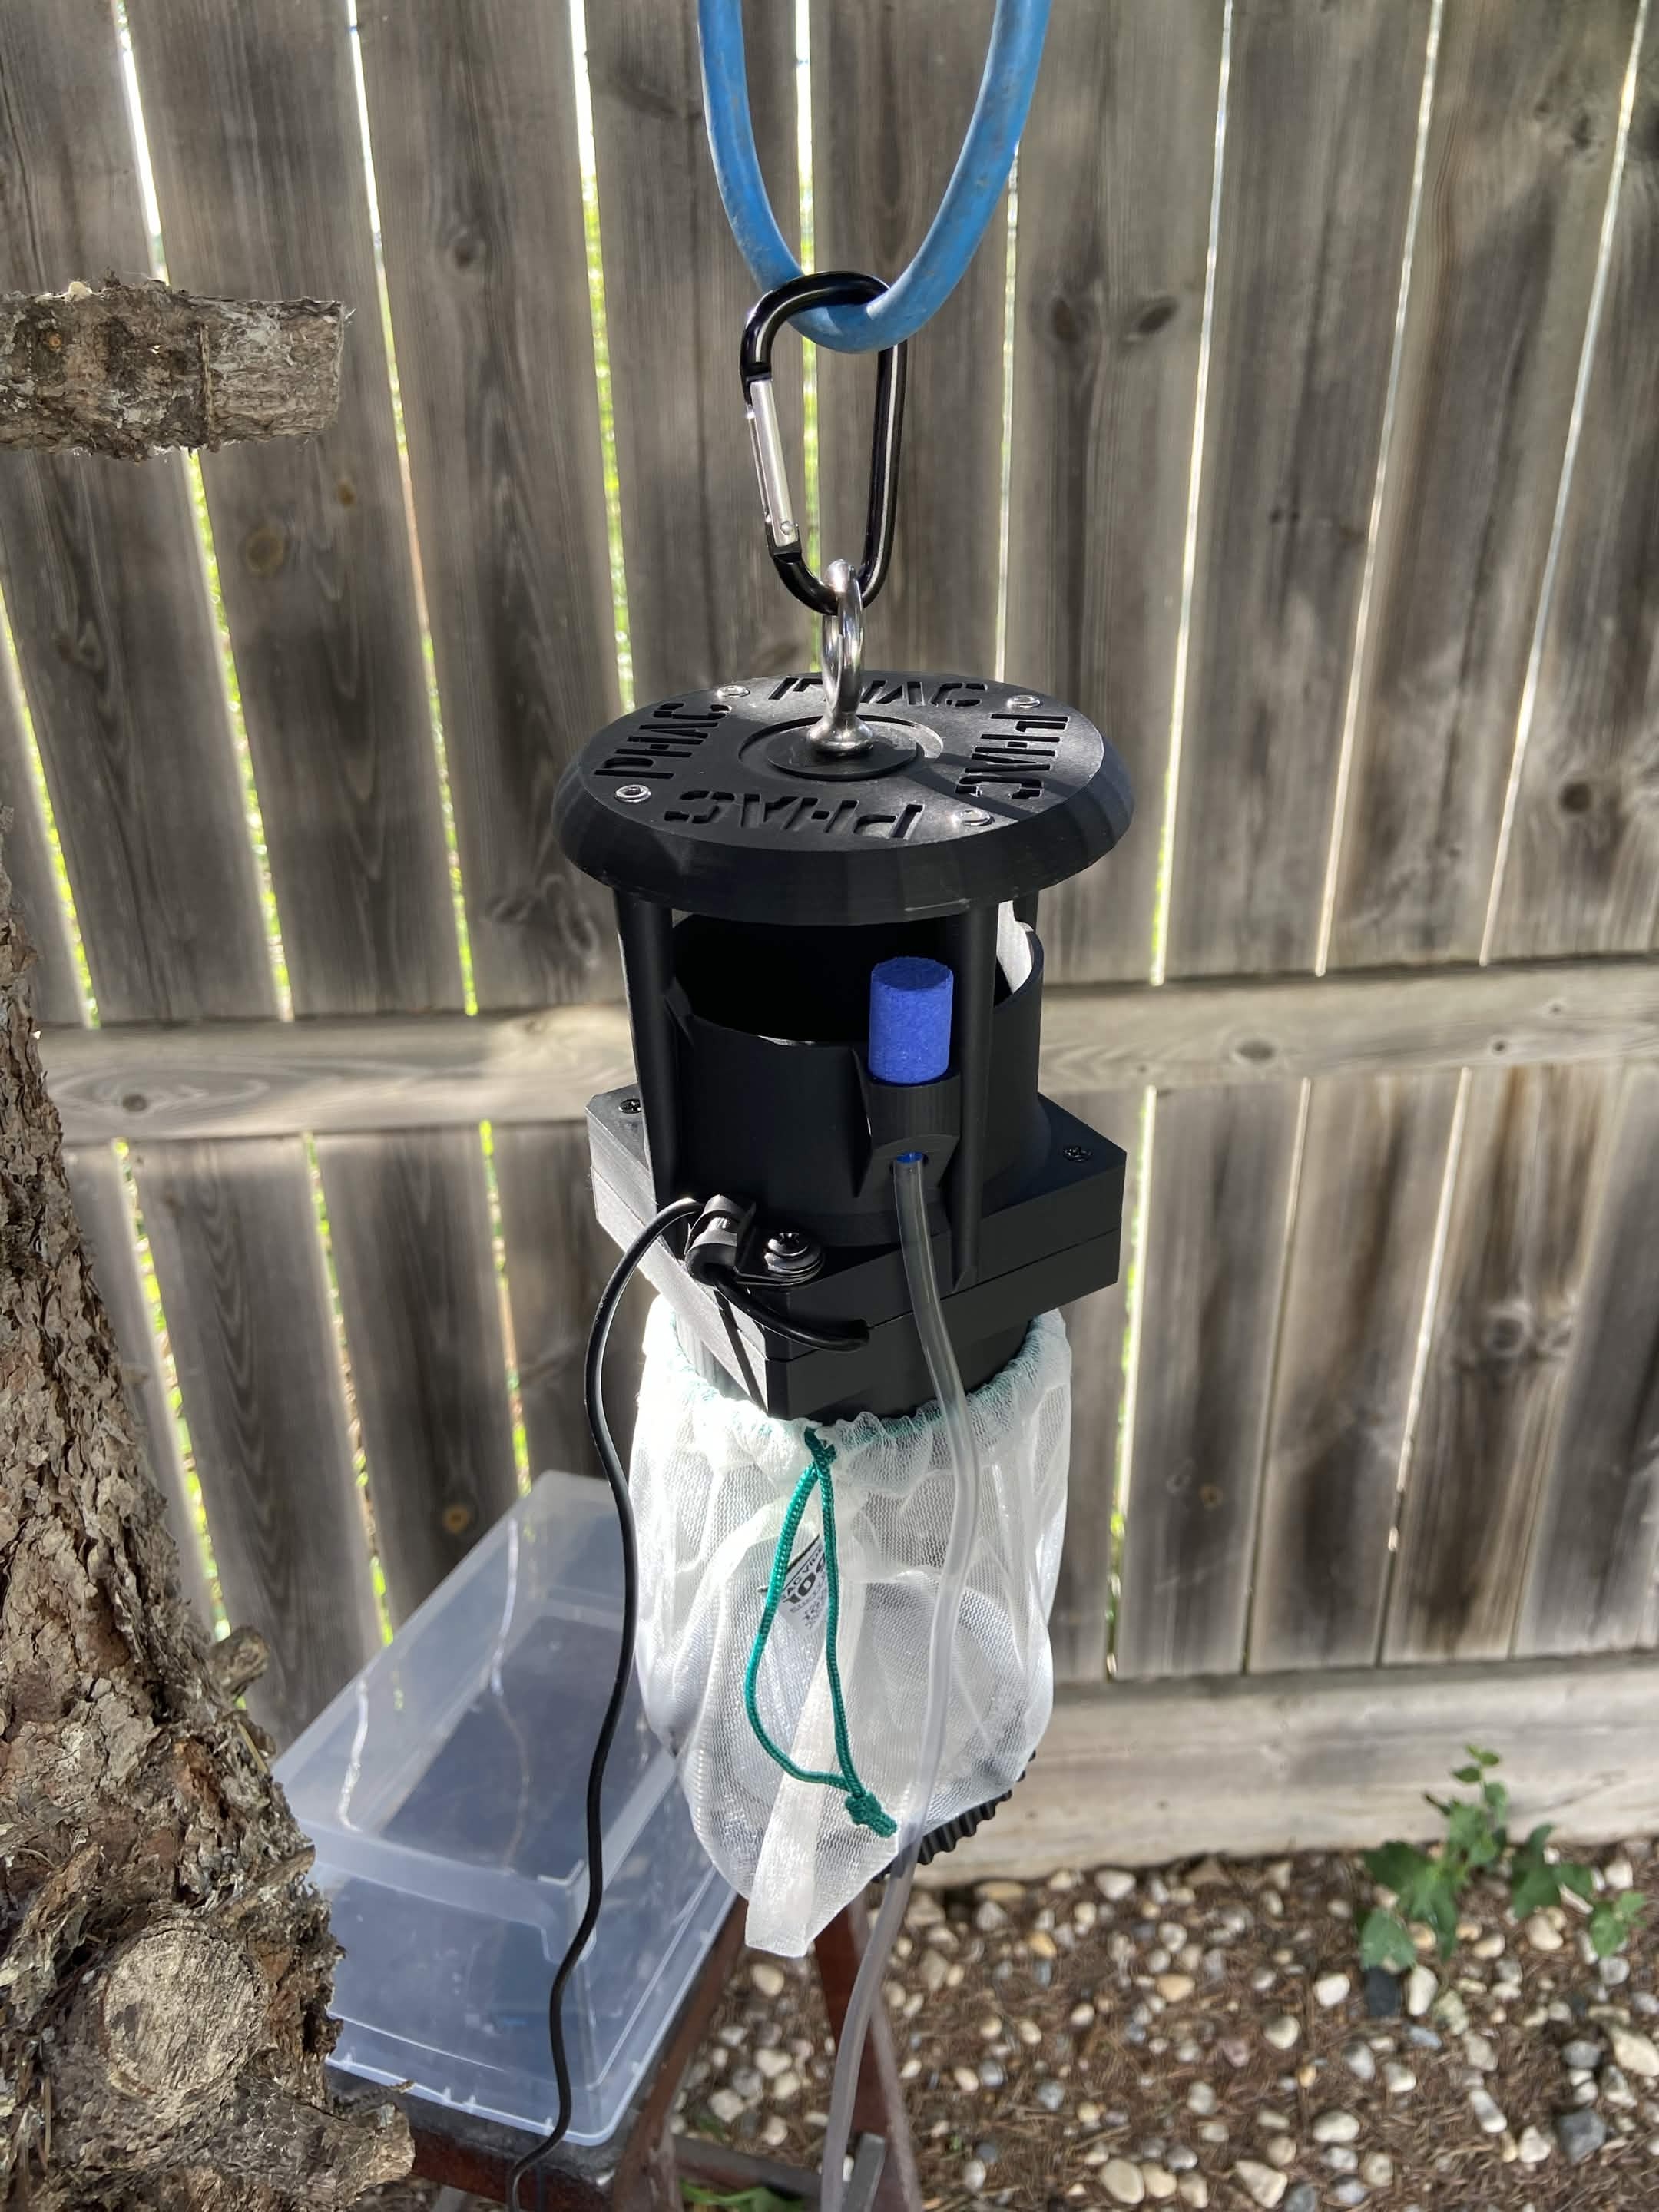 SLC trap setup
To trap mosquitoes, I use a modified Salt Lake City (SLC) trap, which is a 3D printed version of the CDC Miniature Light Trap. Briefly, a compartment houses a fan below an opening. Carbon dioxide is used as bait (female mosquitoes are attracted to carbon dioxide as it indicates the presence of a bloodmeal) and is released via the tubing via the blue airstone. The fan pushes the carbon dioxide down to create a trail. When mosquitoes get close to the opening, the fan also functions to push the mosquitoes downwards into the bag and prevents mosquitoes from escaping (like Finding Nemo for mosquitoes).
For a source of carbon dioxide, I buy dry ice nuggets by the kilogram. It is relatively cheap; about $5 per trap night. I try to trap 2-3x per week weather and time permitting. The trap is allowed to run for 24 hours or until the dry ice runs out. I try to time trapping with ideal weather conditions: warmer overnight temperatures, low wind, and no rain or stormy conditions. However, weather conditions can change without warning.
After trapping, I bring the mosquitoes inside and keep the catch in the freezer for at least an hour to ensure mosquitoes are killed before identification.
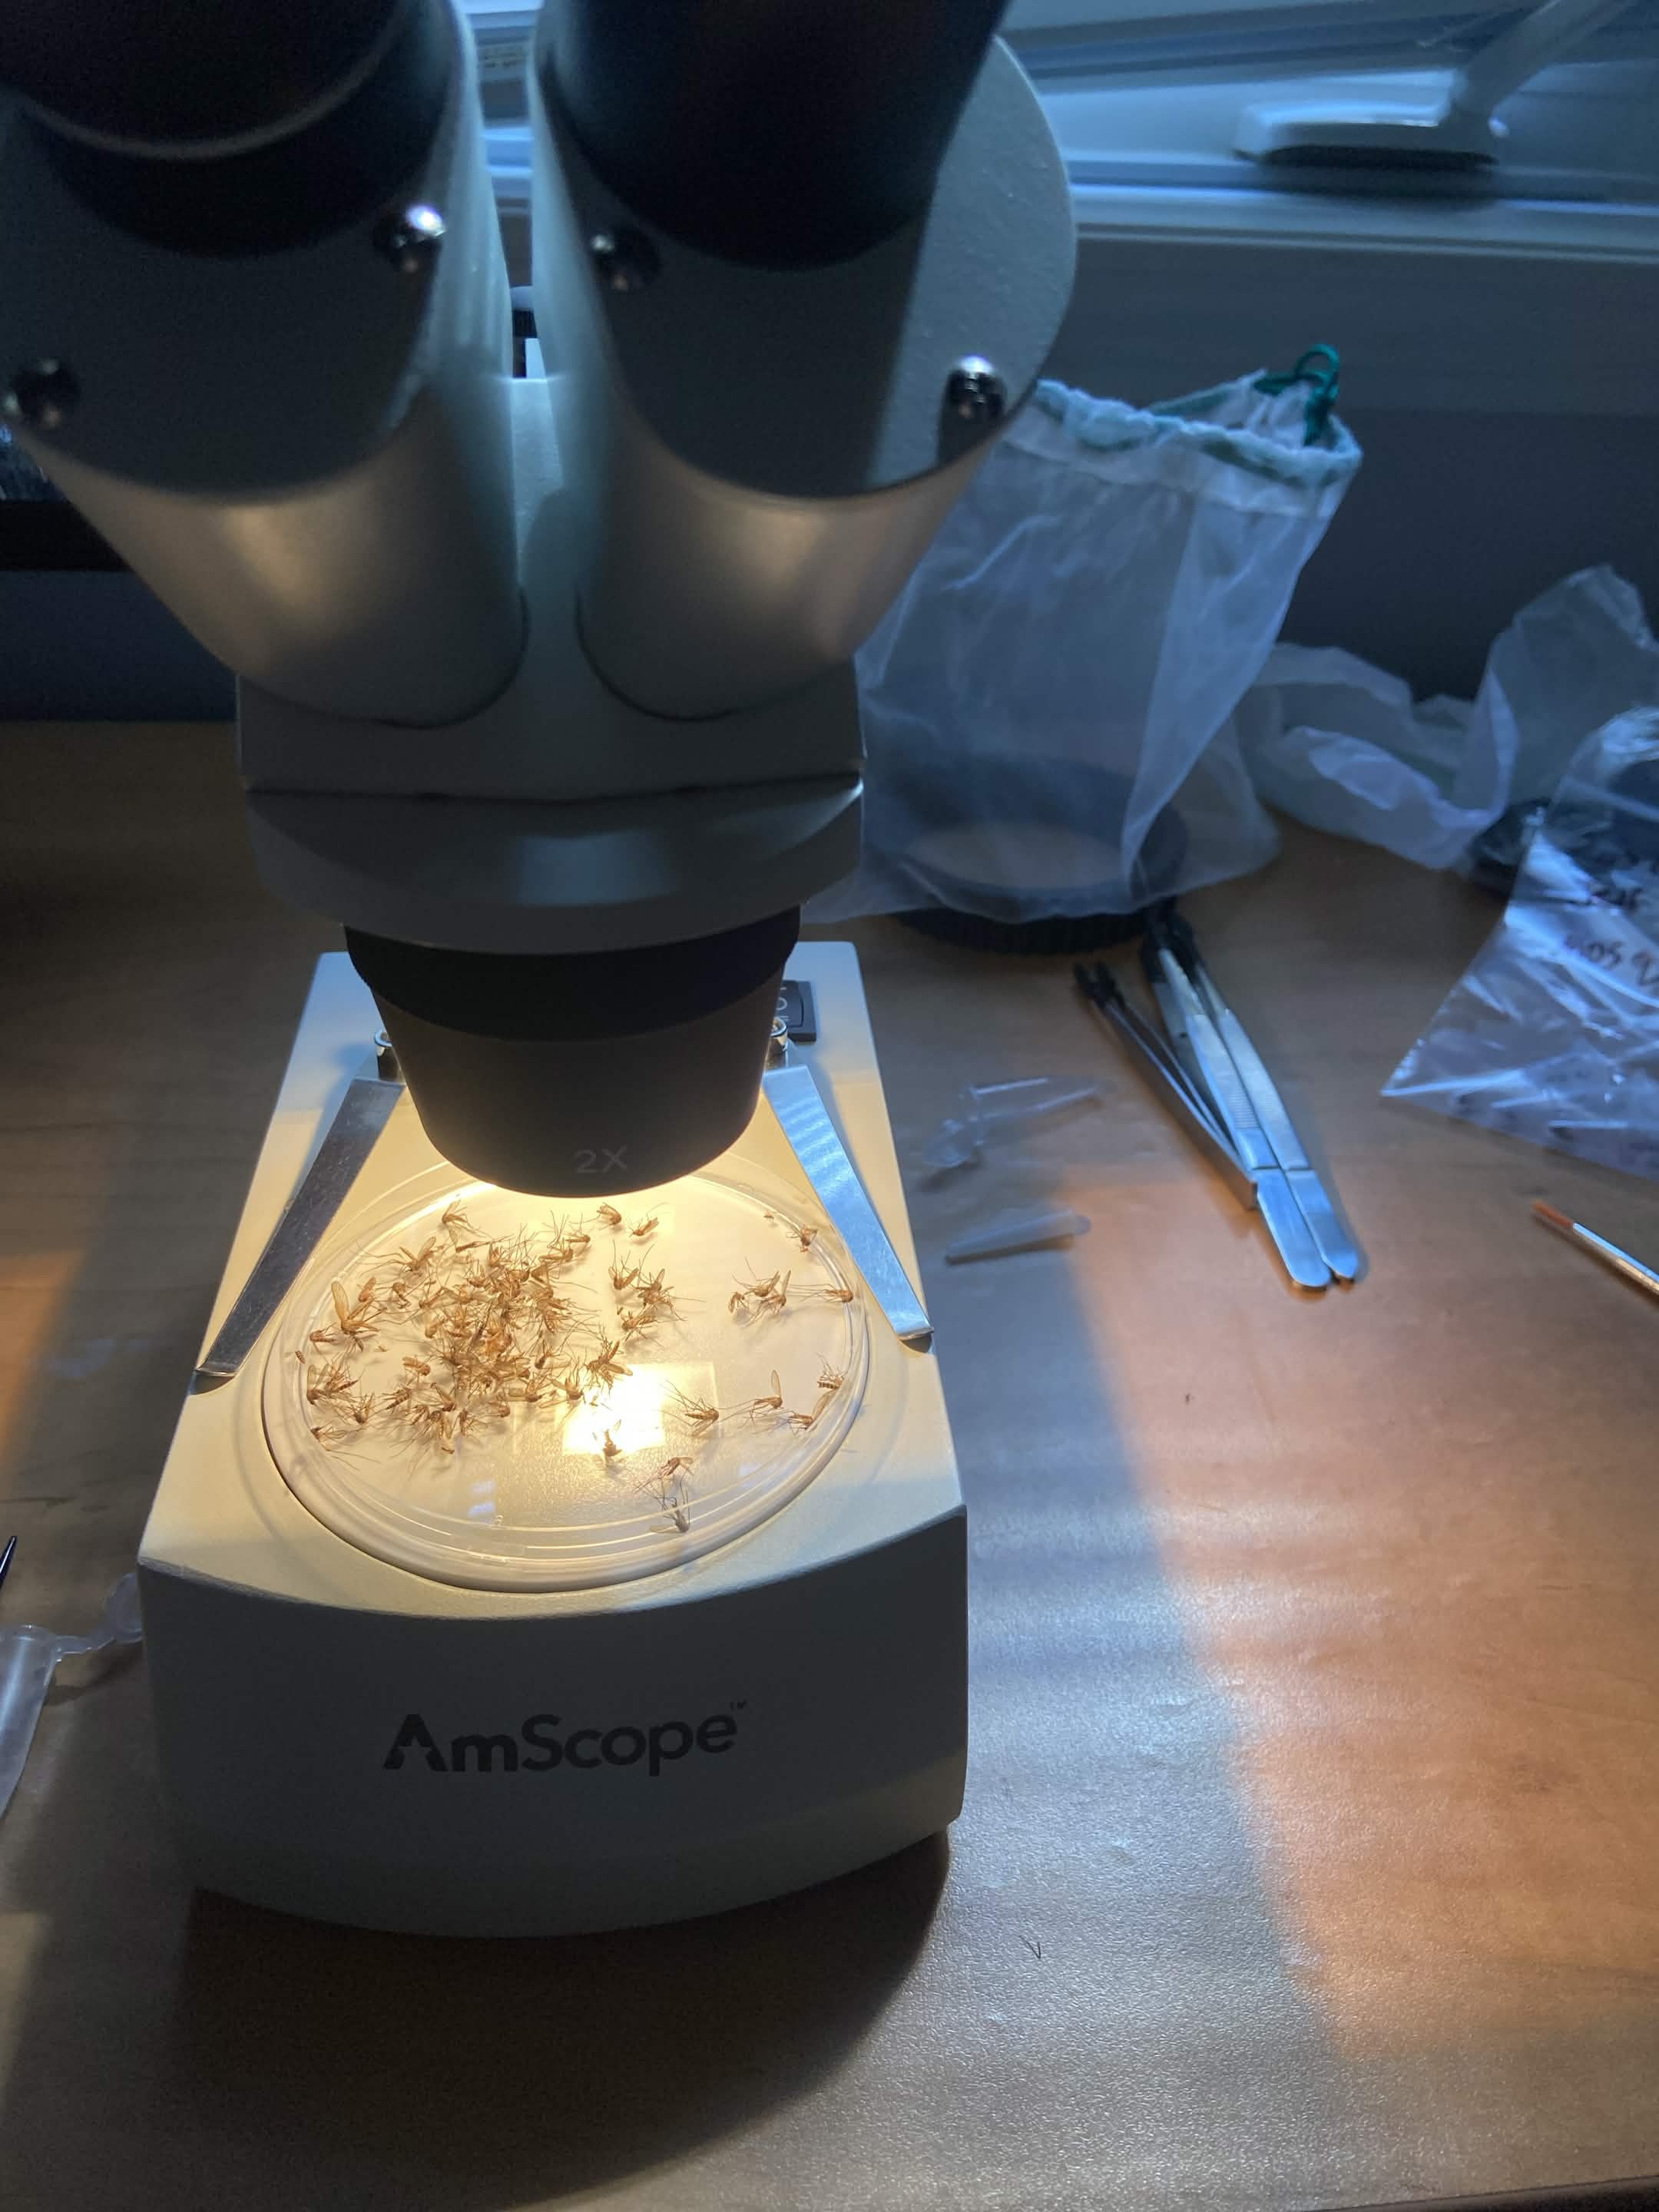 Microscope setup used for mosquito identification
To identify mosquitoes, traps are emptied into a petri dish and are sorted and counted by species. I refer to a great resource by Aynsley Thielman and Fiona Hunter: the Photographic Key to the Adult Female Mosquitoes (Diptera: Culicidae) of Canada.
If there are any specimens too damaged identify, or missing diagnostic parts, they are left at the genus level (e.g., Aedes sp.).
I use a relative cheap dissecting microscope I purchased off Amazon to identify mosquitoes, the AmScope SE306R-PZ Forward Binocular Stereo Microscope. While not ideal for mass sorting, it does the job just fine and can magify at 20X, 40X, 60X and 80X. This comes in handy for viewing fine details such as tarsal claws.
My general process is to sort mosquitoes by easy-to-identify mosquitoes (e.g., Culex tarsalis, Aedes vexans) that I can identify very quickly, and more difficult to ID mosquitoes. I’ll then key out the difficult to ID mosquitoes after all of the “easy” ones are identified. For easy-to-identify mosquitoes, I spend a couple seconds looking at the specimen whereas the difficult species can take up to a couple minutes depending on the quality of the specimen. I’ll then count all the specimens as I put them into tubes and log them into my electronic data sheet.
Overview
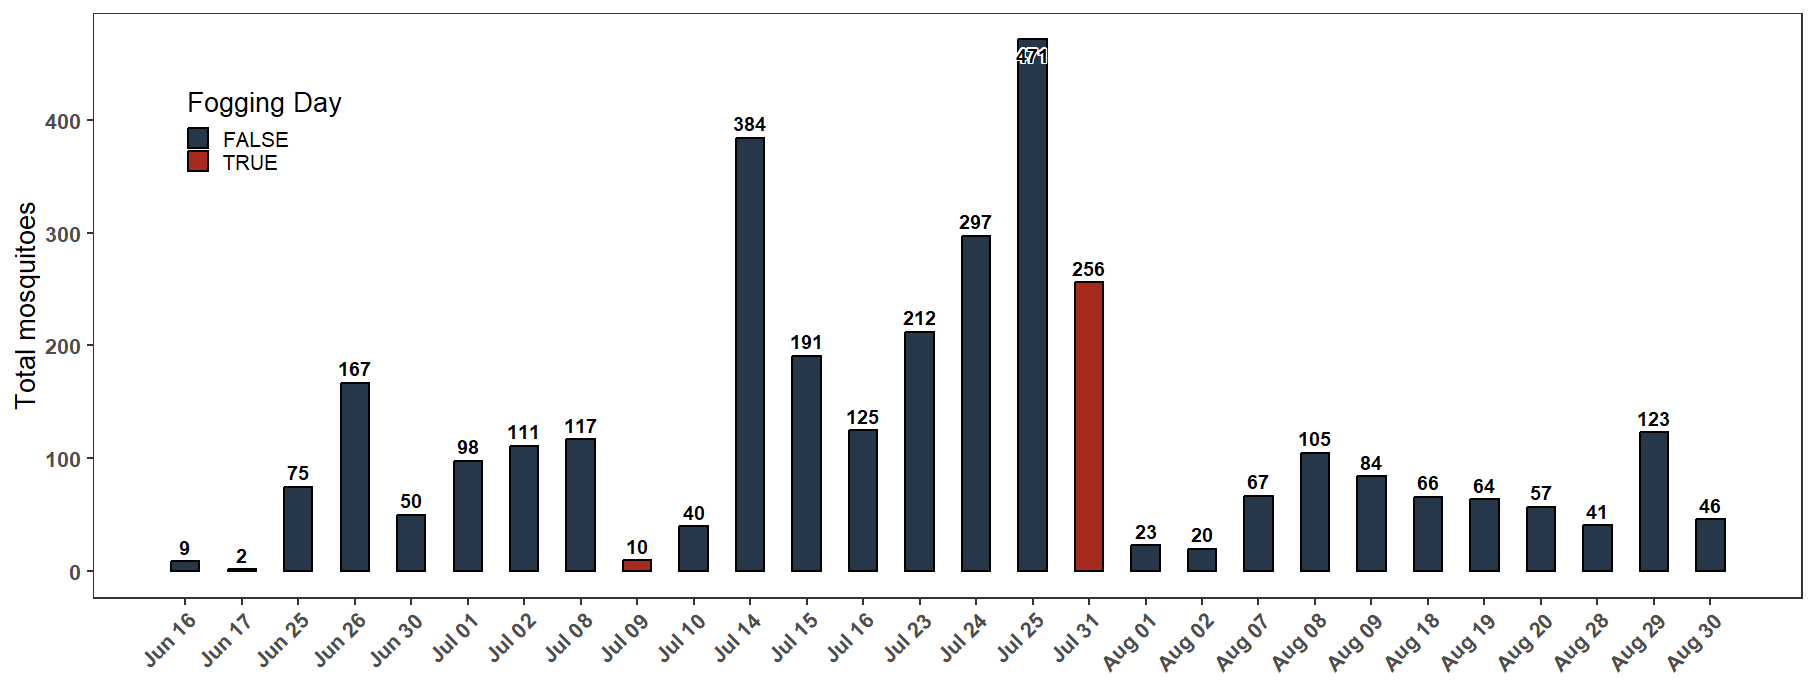
From June 5, 2026 to August 30, 2026, there were 30 trapping events; two events yielded zero mosquitoes. As expected, mosquito counts rose and fell throughout the summer season with peak counts occuring from mid June through to the end of July (Figure 1). In total, I caught 3,311 mosquitoes with the highest number of mosquitoes in one trap being 471 on June 25. I identified 17 unique mosquito species from four mosquito genera. All but 11 mosquitoes could be identified to species (Figure 2). Those that could not be identified to species were a result of significant damage to the specimen or missing diagnostic features.
The City of Winnipeg fogged for mosquitoes in my area two times in 2026. The first fogging event occurred on July 9 and was triggered by a “high” adulticide factor analysis (AFA). The AFA is a metric used to determine when fogging occurs for nuissance mosqutioes. It takes into account factors such as trap counts and weather. Fogging triggerd by a high AFA is subject to buffer zone regulations. The second trapping event occurred on July 31 and was triggered by a Ministerial “Culex tarsalis Order” (“Order” from here on out), which triggers fogging in response to a high risk of West Nile Virus (WNV). When an Order is issued, municipalities may ignore buffer zones. An Order takes into account mosquito pools positive for WNV, number of Culex tarsalis mosquitoes in traps, positive birds, horses, human cases, and weather factors that impact mosquito and virus activity.
After both fogging events, trap counts declined immediately. However, the effects of the first fogging event did not last long. However, after fogging, the trap composition switched from primarily Aedes vexans to Culex tarsalis (Figure 3). After the second fogging event, mosquito counts did drop drastically, however, the weather cooled significantly and likely contributed to the the decrease. My thinking is supported by the fact that counts stabilized shortly after fogging. Thus, if fogging did not occur, I hypothesize that counts would have dropped by the same degree.
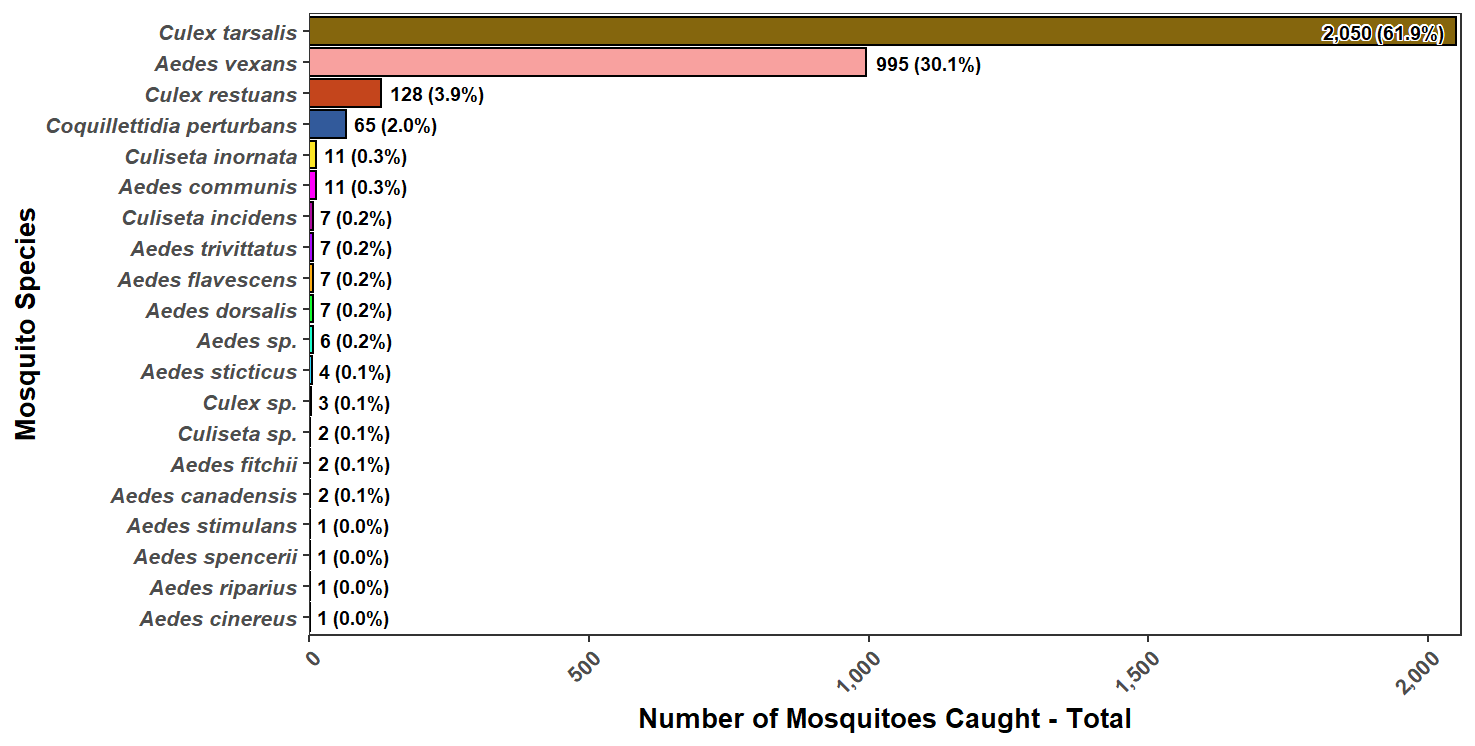
Species Composition
Culex tarsalis made up the majority of mosquitoes caught (61.9%; 2,050) while Aedes vexans came in second (30.1%; 995). Culex restuans (3.9%; 128) and Coquillettidia perturbans (2.0%; 65) made up the majority of the remaining specimens caught. The remainder of specimens made up an array of Aedes (woodland, salt-marsh and snowmelt species; many broad-banded Aedes) and Culiseta species.
The composition was a bit surprising to me. Normally, I would expect the percentages of Culex tarsalis and Aedes vexans to be flipped, however, I suspect Culex tarsalis was so abundant this year due to the extreme heat Winnipeg experienced for much of the summer. Culex tarsalis thrives in hotter weather, while Aedes vexans thrives in more moderate temperatures (Baril et al., 2023).
I was also surprised to have not caught a single Anopheles mosquito. While I did not expect to get many, I did expect to at least get a few.
Mosquito Activity
The season started off with primarily Aedes vexans mosquitoes. After the first fogging event, Aedes vexans drops off while Culex tarsalis numbers increase considerably. While the Culex tarsalis increase and presence generally coincides with the WNV risk period, the large number of Culex tarsalis and the relatively low number of Aedes vexans is likely due to the extreme heat wave Winnipeg experienced (Figure 3).
After the second fogging event, both species decrease and Culex tarsalis bounces back slightly, and continues to decrease as temperatures cool into late August. Interestingly, Aedes vexans rises slowly as temperatures cool (Figure 3).
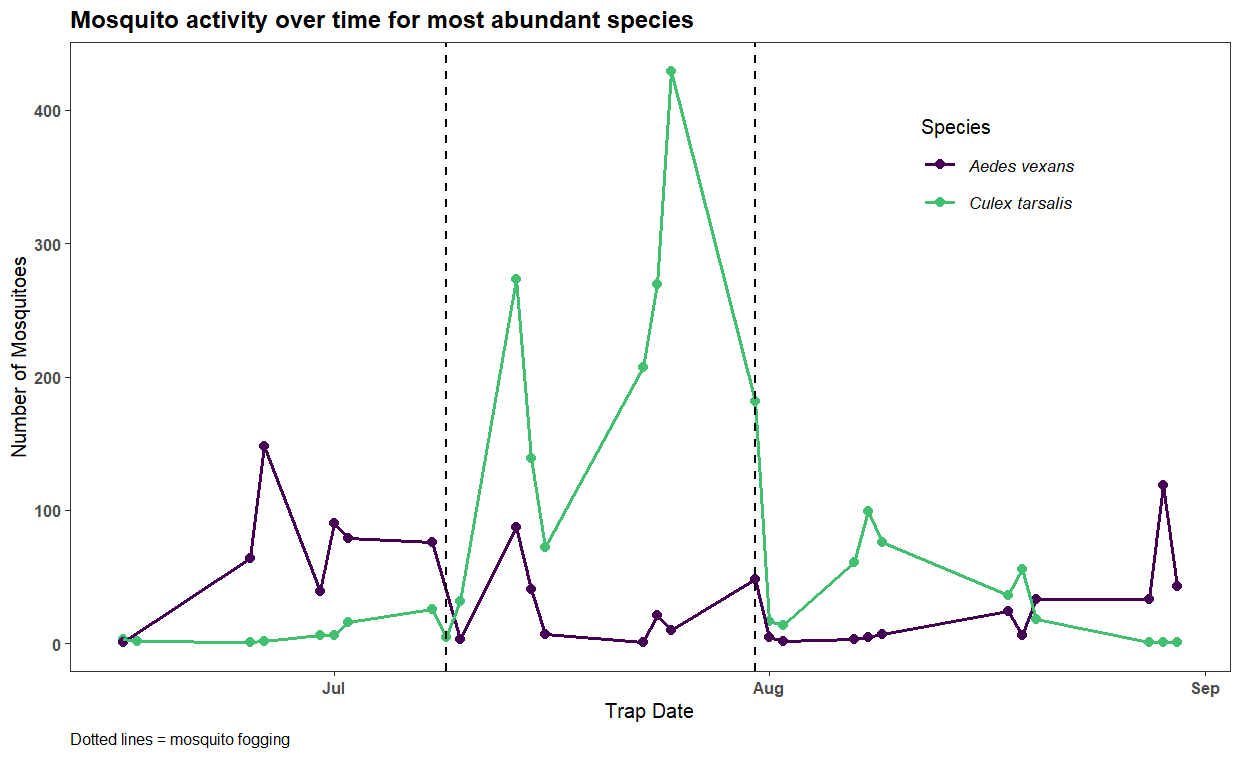
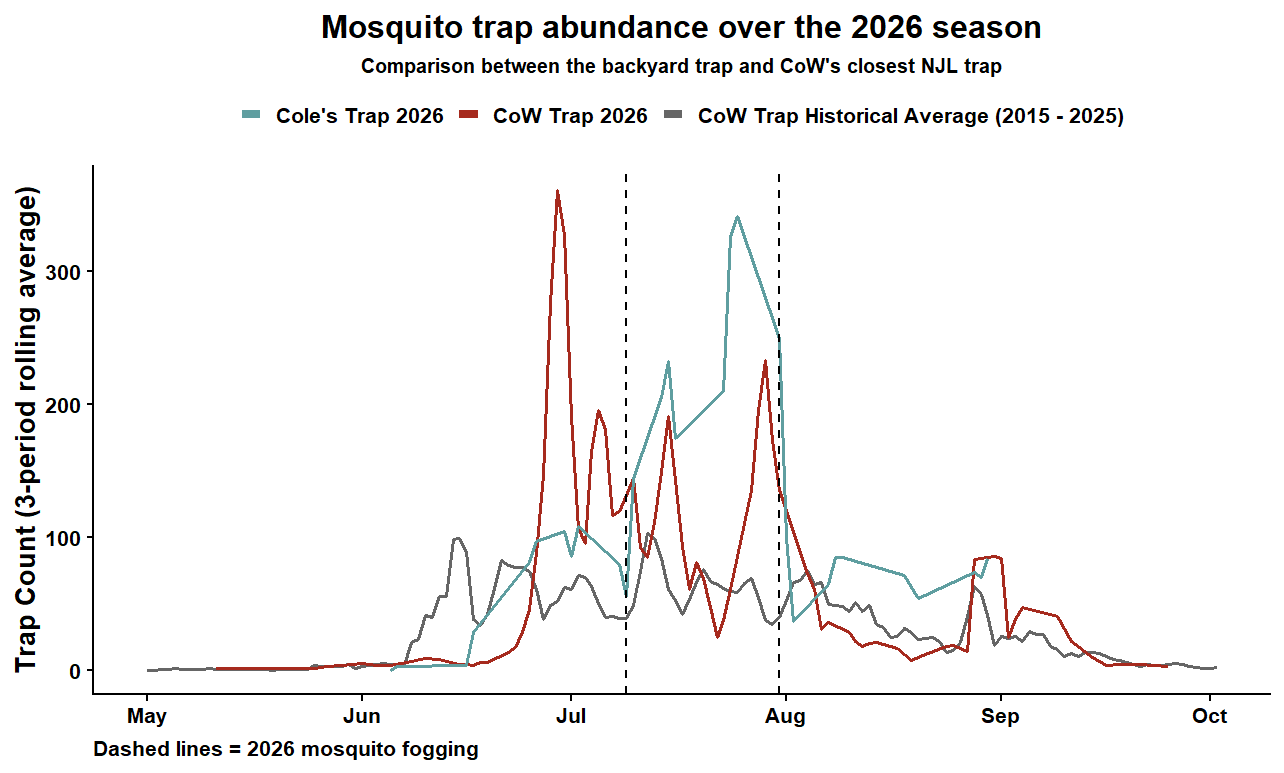
Figure 4 shows 3-period rolling means for my trap (blue), the City’s trap in 2026, and the 2015-2025 historical average for the City trap (grey). The city trap closest to me, I believe, is located in Kildonan park, roughly 2 kilometres from where I live. Mosquito traps are generally only indicative of mosquito activity in a 1 city block radius. Thus, trap counts and compositions can differ drastically for traps even relatively close together and comparing traps at such a distance is futile.
In 2026, the city trap peaks in early July, whereas mine peaks in August. However, for both my trap and the city trap, trap counts were drastically higher than the 10-year historical average. What I would gleam from this is that in the immediate vicinity of either trap, mosquito activity was different at different times of the year. Whereas the city trap is in an urban park with a lot of tree and ground cover, mine if half surrounded by housing developments and half by a large open undeveloped field which could account for differences in composition.
Exploratory Weather Analysis
One thing I wanted to attempt to answer was which weather variables and preceding weather windows show associations with mosquito trap counts, and if so, what direction and magnitude are these associations?
Thus, I conducted an exploratory analysis to examine potential relationships between weather conditions and mosquito abundance. The analysis included 30 trapping events conducted at a single location during one mosquito season. Because of the relatively small sample size and limited spatial and temporal coverage, the analysis was intended to identify patterns and generate hypotheses rather than establish causal relationships or develop a predictive model.
For each trapping event, mosquito abundance was calculated as the total number of mosquitoes collected (or species for the specific-specific analysis). Weather conditions during the 0 to 28 days preceding each trapping event were evaluated to investigate whether recent or longer-term weather conditions were associated with mosquito abundance. Weather variables included measures of temperature, precipitation, relative humidity, wind speed, and accumulated degree days.
Each weather variable and preceding weather window was examined separately using simple linear regression, with mosquito abundance as the response variable and the weather measurement as the explanatory variable. Separate models were used rather than a multivariable model because the limited number of trapping events would not support reliable estimation of the independent effects of numerous, often highly correlated weather variables.
The regression coefficient (slope) was used as a measure of the direction and magnitude of each relationship. For example, a coefficient of +5 for mean temperature would indicate that a one-degree increase in mean temperature was associated with an estimated increase of five mosquitoes per trapping event. Positive coefficients therefore indicate associations with increased mosquito abundance, while negative coefficients indicate associations with decreased abundance.
For each regression, a p-value was calculated to assess the statistical evidence for a relationship between the weather variable and mosquito abundance. Relationships with p < 0.05 were identified as statistically significant. Because the same weather variable was examined across multiple overlapping weather windows, conducting many statistical tests increases the probability of identifying an apparently significant relationship by chance. Benjamini–Hochberg correction was therefore applied across the 29 weather windows for each weather variable to control the false discovery rate. Results that remained significant following this correction were identified separately.
The weather windows are not independent; for example, weather summarized over the preceding 14 and 15 days contains largely the same observations. Consequently, patterns occurring across several neighbouring windows were considered more informative than an isolated significant result at a single window.
Culex tarsalis
| Weather Relationships with Mosquito Trap Counts - Culex tarsalis | ||||||||||
| Estimated change in mosquito count per 1-unit increase in each weather variable | ||||||||||
| Days | ||||||||||
|---|---|---|---|---|---|---|---|---|---|---|
| 0 | ||||||||||
| 1 | ||||||||||
| 2 | ||||||||||
| 3 | ||||||||||
| 4 | ||||||||||
| 5 | ||||||||||
| 6 | ||||||||||
| 7 | ||||||||||
| 8 | ||||||||||
| 9 | ||||||||||
| 10 | ||||||||||
| 11 | ||||||||||
| 12 | ||||||||||
| 13 | ||||||||||
| 14 | ||||||||||
| 15 | ||||||||||
| 16 | ||||||||||
| 17 | ||||||||||
| 18 | ||||||||||
| 19 | ||||||||||
| 20 | ||||||||||
| 21 | ||||||||||
| 22 | ||||||||||
| 23 | ||||||||||
| 24 | ||||||||||
| 25 | ||||||||||
| 26 | ||||||||||
| 27 | ||||||||||
| 28 | ||||||||||
| Interpretation: Values represent the estimated change in mosquito trap count associated with a 1-unit increase in the corresponding weather variable. | ||||||||||
| * p < 0.05 † remains significant after Benjamini–Hochberg correction. | ||||||||||
Aedes vexans
| Weather Relationships with Mosquito Trap Counts - Aedes vexans | ||||||||||
| Estimated change in mosquito count per 1-unit increase in each weather variable | ||||||||||
| Days | ||||||||||
|---|---|---|---|---|---|---|---|---|---|---|
| 0 | ||||||||||
| 1 | ||||||||||
| 2 | ||||||||||
| 3 | ||||||||||
| 4 | ||||||||||
| 5 | ||||||||||
| 6 | ||||||||||
| 7 | ||||||||||
| 8 | ||||||||||
| 9 | ||||||||||
| 10 | ||||||||||
| 11 | ||||||||||
| 12 | ||||||||||
| 13 | ||||||||||
| 14 | ||||||||||
| 15 | ||||||||||
| 16 | ||||||||||
| 17 | ||||||||||
| 18 | ||||||||||
| 19 | ||||||||||
| 20 | ||||||||||
| 21 | ||||||||||
| 22 | ||||||||||
| 23 | ||||||||||
| 24 | ||||||||||
| 25 | ||||||||||
| 26 | ||||||||||
| 27 | ||||||||||
| 28 | ||||||||||
| Interpretation: Values represent the estimated change in mosquito trap count associated with a 1-unit increase in the corresponding weather variable. | ||||||||||
| * p < 0.05 † remains significant after Benjamini–Hochberg correction. | ||||||||||
References
Baril, C., Pilling, B.G., Mikkelsen, M.J. et al. The influence of weather on the population dynamics of common mosquito vector species in the Canadian Prairies. Parasites Vectors 16, 153 (2023). https://doi.org/10.1186/s13071-023-05760-x.
Let’s Talk Science. (2026). TIMO-CS. https://letstalkscience.ca/outreach/uwindsor/local-programs/timo-cs.
City of Winnipeg (2026). Nuisance Mosquito Trap Counts. https://legacy.winnipeg.ca/publicworks/insectcontrol/mosquitoes/trapcounts.stm.
Environment and Climate Change Canada (2024). WINNIPEG A CS Weather Station. https://climate.weather.gc.ca/climate_data/.
R Core Team (2023). R: A Language and Environment for Statistical Computing. R Foundation for Statistical Computing, Vienna, Austria. https://www.R-project.org/.
Wickham H, Averick M, Bryan J, Chang W, McGowan LD, François R, Grolemund G, Hayes A, Henry L, Hester J, Kuhn M, Pedersen TL, Miller E, Bache SM, Müller K, Ooms J, Robinson D, Seidel DP, Spinu V, Takahashi K, Vaughan D, Wilke C, Woo K, Yutani H (2019). “Welcome to the tidyverse.” Journal of Open Source Software, 4(43), 1686. doi:10.21105/joss.01686 https://doi.org/10.21105/joss.01686.
LaZerte S, Albers S (2018). “weathercan: Download and format weather data from Environment and Climate Change Canada.” The Journal of Open Source Software, 3(22), 571. https://joss.theoj.org/papers/10.21105/joss.00571.
Firke S (2023). janitor: Simple Tools for Examining and Cleaning Dirty Data. R package version 2.2.0, https://CRAN.R-project.org/package=janitor.